

Over the past six months, Sinclair has been a great trade. While the S&P 500 was flat, the stock price has climbed by 10.5% to $15.55 per share. This was partly thanks to its solid quarterly results, and the performance may have investors wondering how to approach the situation.
Is now the time to buy Sinclair, or should you be careful about including it in your portfolio? Get the full stock story straight from our expert analysts, it’s free.
Despite the momentum, we don't have much confidence in Sinclair. Here are three reasons why there are better opportunities than SBGI and a stock we'd rather own.
Why Do We Think Sinclair Will Underperform?
With over 2,400 hours of local news produced weekly and 640 broadcast channels reaching millions of American homes, Sinclair (NASDAQ:SBGI) operates a network of 185 local television stations across 86 U.S. markets, producing news programming and distributing content from major networks.
1. Revenue Spiraling Downwards
A company’s long-term performance is an indicator of its overall quality. Any business can put up a good quarter or two, but many enduring ones grow for years. Over the last five years, Sinclair’s demand was weak and its revenue declined by 3.5% per year. This wasn’t a great result and is a sign of poor business quality. 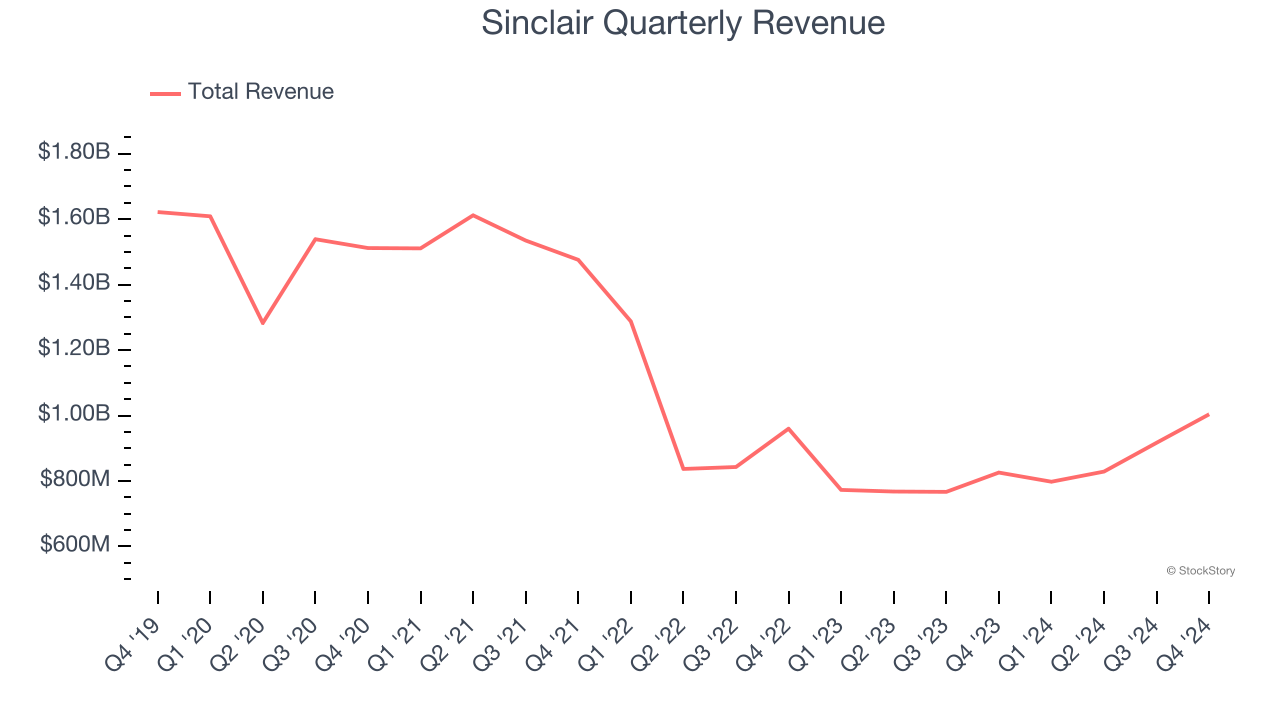
2. Revenue Projections Show Stormy Skies Ahead
Forecasted revenues by Wall Street analysts signal a company’s potential. Predictions may not always be accurate, but accelerating growth typically boosts valuation multiples and stock prices while slowing growth does the opposite.
Over the next 12 months, sell-side analysts expect Sinclair’s revenue to drop by 10.5%, a decrease from its 5% annualized declines for the past two years. This projection doesn't excite us and indicates its products and services will face some demand challenges.
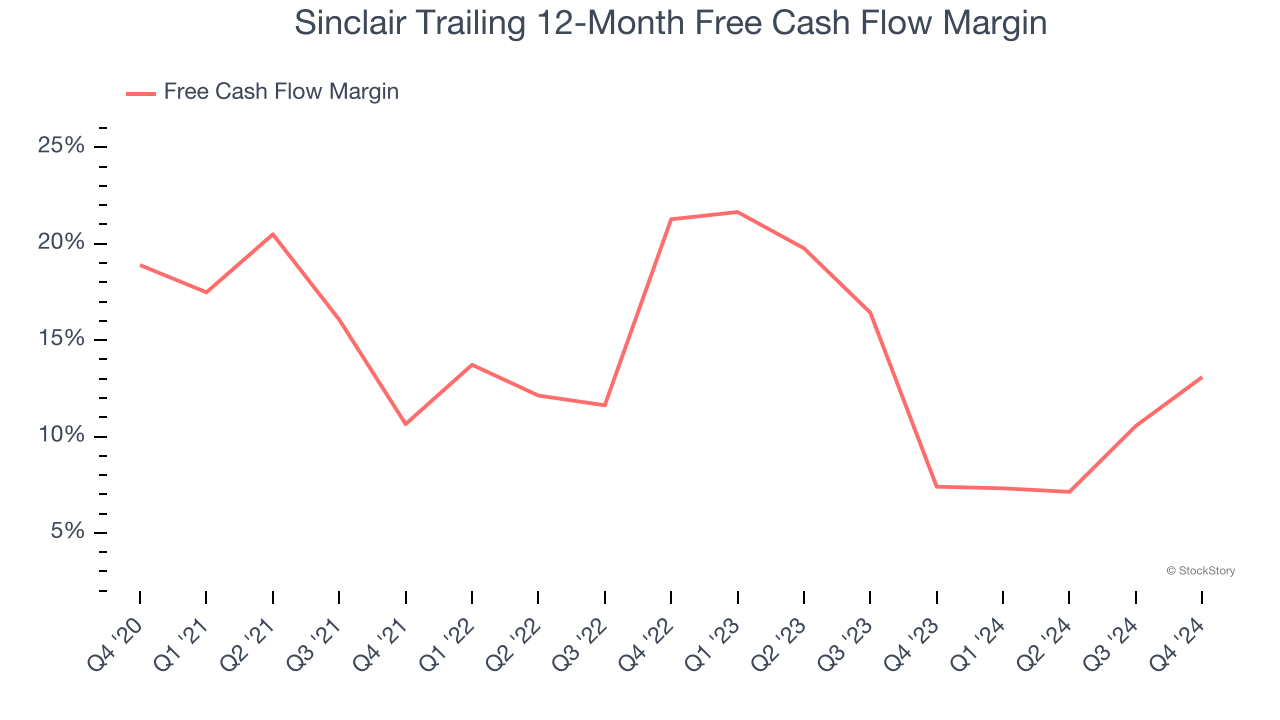
3. Free Cash Flow Margin Dropping
Free cash flow isn't a prominently featured metric in company financials and earnings releases, but we think it's telling because it accounts for all operating and capital expenses, making it tough to manipulate. Cash is king.
As you can see below, Sinclair’s margin dropped by 5.8 percentage points over the last five years. It may have ticked higher more recently, but shareholders are likely hoping for its margin to at least revert to its historical level. If the longer-term trend returns, it could signal increasing investment needs and capital intensity. Sinclair’s free cash flow margin for the trailing 12 months was 13.1%.
Final Judgment
Sinclair doesn’t pass our quality test. With its shares outperforming the market lately, the stock trades at 2× forward EV-to-EBITDA (or $15.55 per share). While this valuation is optically cheap, the potential downside is huge given its shaky fundamentals. There are superior stocks to buy right now. We’d recommend looking at a dominant Aerospace business that has perfected its M&A strategy.
Stocks We Would Buy Instead of Sinclair
With rates dropping, inflation stabilizing, and the elections in the rearview mirror, all signs point to the start of a new bull run - and we’re laser-focused on finding the best stocks for this upcoming cycle.
Put yourself in the driver’s seat by checking out our Top 9 Market-Beating Stocks. This is a curated list of our High Quality stocks that have generated a market-beating return of 175% over the last five years.
Stocks that made our list in 2019 include now familiar names such as Nvidia (+2,183% between December 2019 and December 2024) as well as under-the-radar businesses like Comfort Systems (+751% five-year return). Find your next big winner with StockStory today for free.